| Contenuti del sito | Decisive Tools, LLC. was founded in 1999 with the objective of developing a new generation of business analysis software. Word processing software, spreadsheets, and databases have become widespread and are accepted as standard business applications. Now a new set of business applications is forming the next 'tier' of general-purpose software tools. Business analysis software will be a core component of this tier and Decisive Tools plans to be at the forefront of this category offering products that address the needs of a wide audience of users.
The vision of Decisive Tools is to create software that can be used by business managers across a wide range of organizations. Its first project was to take the existing Scenario software program and adjust it to meet the needs of the general business manager. The product's technical depth was retained but a new look was incorporated. The result is a powerful decision analysis tool that does not require its users to have extensive backgrounds in statistical analysis. Complex decisions are analyzed quickly which enables users to confidently determine the optimal outcome for any situation. Renamed iDecideTM, the program is quickly finding its way into companies around the world. Training services and custom model-building programs are offered to assist users in incorporating the software into their organizations. The company's web site provides users with technical support and additional sample decision models that can be downloaded. Moving forward, the company plans to expand on the capabilities of this product as well as to develop additional applications for business managers.
How iDecide Works
Here is a description of how iDecide 2000 can help you make better, smarter decisions.
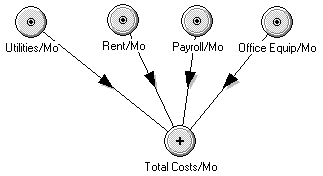
Figure 1.3.1 Influence Diagram

Influence Diagrams
You begin by creating a graphical picture of your situation, known as an influence diagram. Influence diagrams exist as a powerful method to structure a decision situation. Compared to other methods, influence diagrams are easier to understand and show the relationship between different decision factors better. If you are presenting your decision situation to another individual, influence diagrams are the perfect choice to get the message across.
The diagram is comprised of "nodes" and "edges." Each variable in your decision - cost of goods, revenue, or whatever - is represented as a node. Nodes can be linked together to show the relationships between them; these are represented by lines called edges.
Some of the nodes have definite values, but many will vary. Here is where the power of iDecide 2000. comes into play. You can mix and match different types of nodes and different ranges of values - whatever is needed to describe your situation. For example, you may know the price of a material, but you’re not sure exactly how many you’ll sell, and maybe, there’s a 1-in-3 chance that a new competitor will enter the market. All this is included in your diagram.
 Monte Carlo Simulation Monte Carlo Simulation
After you lay out your diagram, it’s time to model it. iDecide 2000 uses Monte Carlo methods to simulate your situation and give you the range and likelihood of all possible outcomes. Monte Carlo modeling takes randomly selected values of every node in the model and uses them in combination with each other until a statistically accurate representation of all possible combinations has been created. What this means to you is that within seconds, you get to see what’s likely to happen. With this information, you can decide the best course of action.
The Results
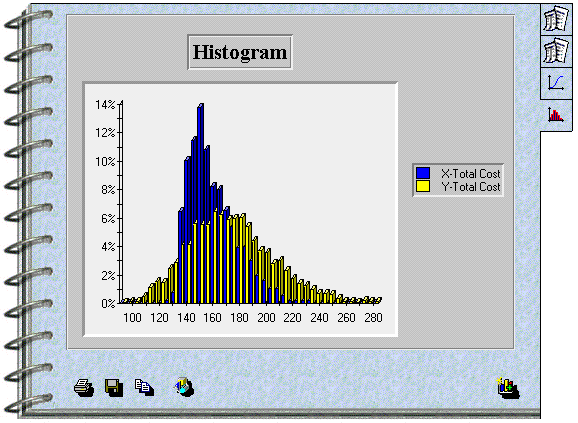
The results of the simulation are displayed for you in the Analysis Notebook. This notebook contains simulation reports and all the graphs and charts you wanted to include in your simulation.
Figure 1.3.2 - Results Notebook

The simulation may show you that the best place to spend your marketing dollars is in direct mail instead of advertising. It may show you that you should hire additional contract workers to speed up the project, or that you’re underestimating the costs on your last three bids.
What If?
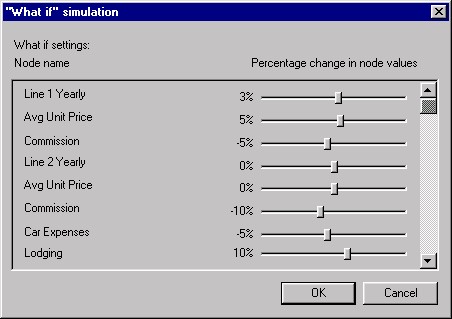
The results of the simulation often will lead to more questions - the "what if" kind. What if marketing promotions cost 15% more? What if only one contract worker is used? What if you can lower your costs by 10%? All of these questions are easily answered using the What If feature in iDecide 2000.
Figure 1.3.3 - "What if" Simulation

Using this feature, you can adjust the value of a variable by a percentage to see how it affects the overall results. Here, you can fine tune your decision until you get the results you need.
Features and Benefits
The powerful features in iDecide 2000 allow you to:
- build influence diagrams to graphically represent any decision situation
- plan for any uncertainties in your decision
- perform Monte Carlo methods to simulate your model thousands of times to show you the likelihood and range of possible outcomes
- view colorful and informative graphs and tables displaying the simulation results
- produce high quality reports and analysis
- use the Model Builder to automate the process of laying out a decision model that fits your needs
- browse through the collection of pre-made sample models for ideas
- use iDecide 2000 as a stand-alone product or integrate with Microsoft Excel™
Using iDecide 2000, you will understand the decisions you face and thus make better, smarter decisions. By making better, smarter decisions, you can:
- reduce your costs
- increase your profits
- better utilize resources
- increase your productivity
- maximize opportunities
- build on your experience and intuition
Once you start using iDecide 2000, you’ll find it indispensable for making better decisions for your business or organization. You’ll have models to build for quick decisions such as leasing or buying equipment. You’ll also have models that you build and modify over time for things like pricing or staffing decisions.
So take your experience, your intuition, and add iDecide 2000 to get the most out of your business.
|